
- Stellar surged by 57% weekly as Protocol 23 upgrade and tokenized U.S. Treasuries boost real-world asset adoption.
- RSI at 83.41 and Stochastic RSI at 100 signal overbought levels, raising chances of a short-term pullback.
- XLM trades above key MAs with a golden cross, confirming a long-term bullish trend if $0.37–$0.40 range holds.
Stellar (XLM) continued its strong upward momentum on July 12, trading at $0.3749 with a 23.21% increase in the past 24 hours. The token has surged by 57.52% over the last week and gained 36.43% in the past month.
According to CoinMarketCap, XLM is one of the day’s top trending coins. Its market cap rose to $11.66 billion, while trading volume jumped by 284.81% to $2.34 billion. These sharp moves come amid mounting interest in Stellar’s smart contract integration and growing real-world asset (RWA) utility, as well as a shift in capital toward large-cap altcoins.


Protocol Upgrade and RWA Adoption Drive Momentum
The main catalyst behind XLM’s surge is Stellar’s upcoming Protocol 23 upgrade, scheduled for validator vote on August 14. This upgrade will enable smart contracts and introduce parallel processing, improving network capacity.
Notably, Franklin Templeton’s $445 million tokenized U.S. Treasuries are hosted on Stellar, supporting its RWA use case. Analysts credit the upgrade and institutional usage as major factors behind XLM’s 56% weekly gain.
Adding to the bullish sentiment is the ongoing rotation from Bitcoin into altcoins. Bitcoin reached a new all-time high of $118,760, while BTC dominance dropped 0.12% over the past day.
According to Santiment, this decline has sparked the beginning of altcoin season. XLM led among large-cap gainers, alongside XRP and ADA, with market analysts like Matthew Hyland expecting more upside if Bitcoin’s dominance continues to decline.
Technical Indicators Confirm a Bullish Breakout
From a technical view, XLM recently broke above key resistance levels of $0.30 and $0.34. Price action reached a high of $0.4078 on a daily high. Bollinger Bands show the token trading well above the upper band of $0.3396, confirming strong momentum.
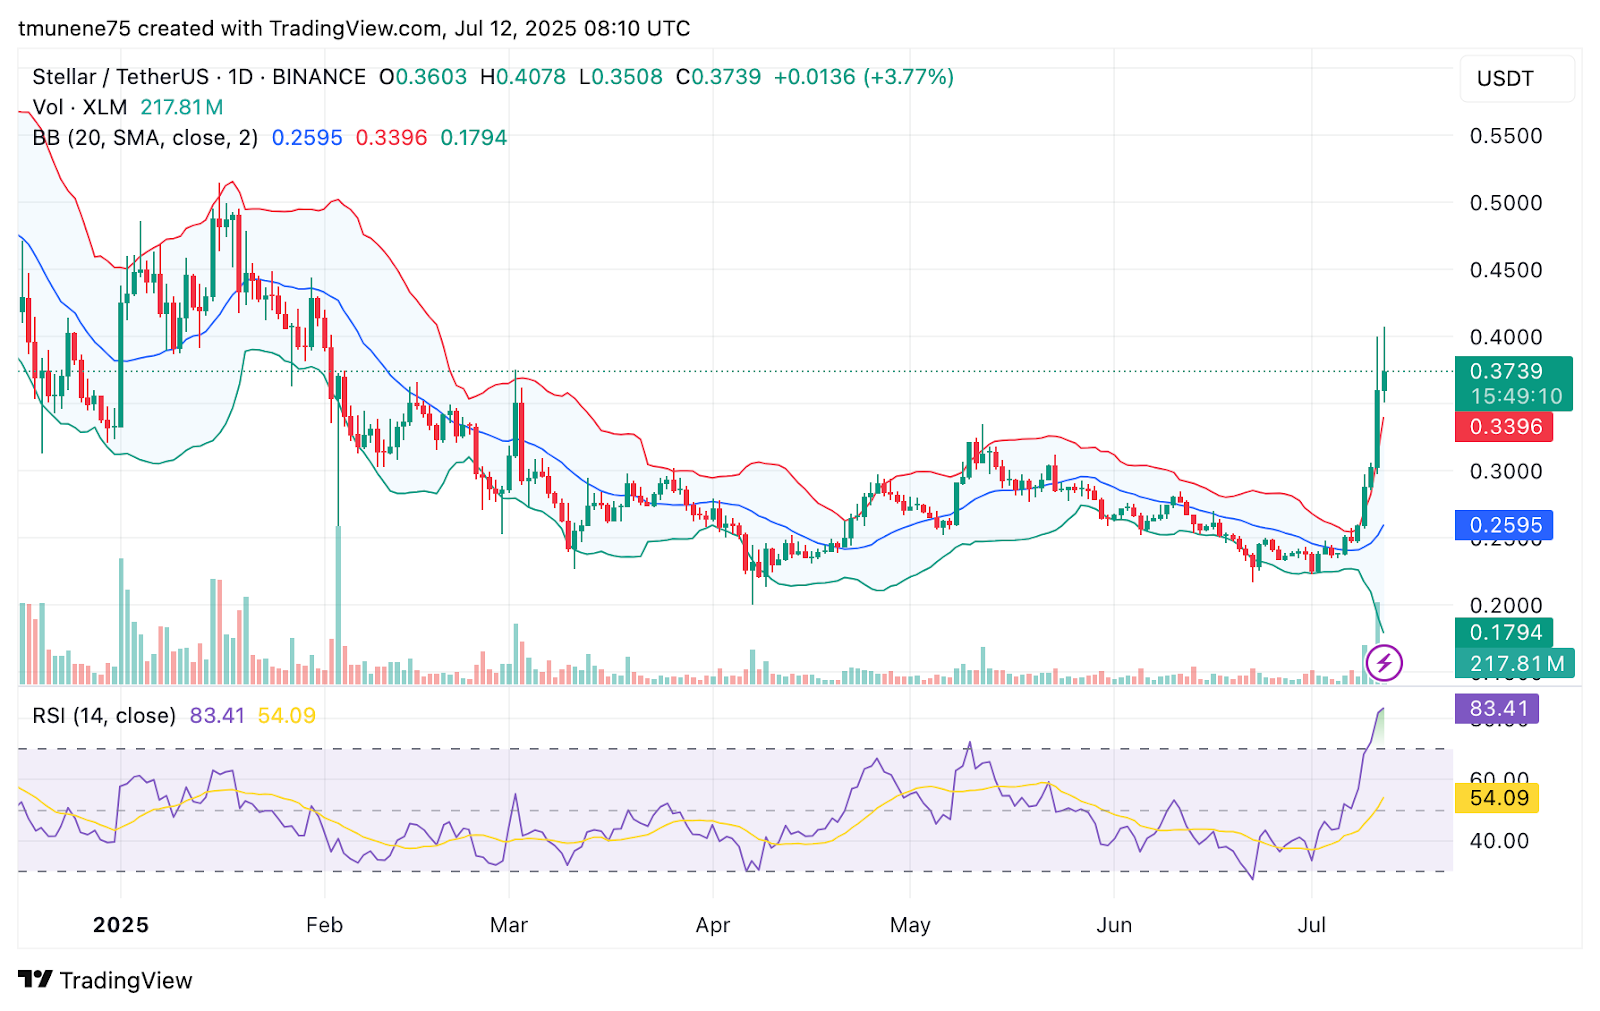
However, the RSI is at 83.41, well above the 70 level, indicating an overheated condition that may cause a short-term correction. Momentum indicators also point to extreme strength. The Stochastic RSI is at 100, while On-Balance Volume (OBV) and Accumulation/Distribution (A/D) both show sharp upward trends.
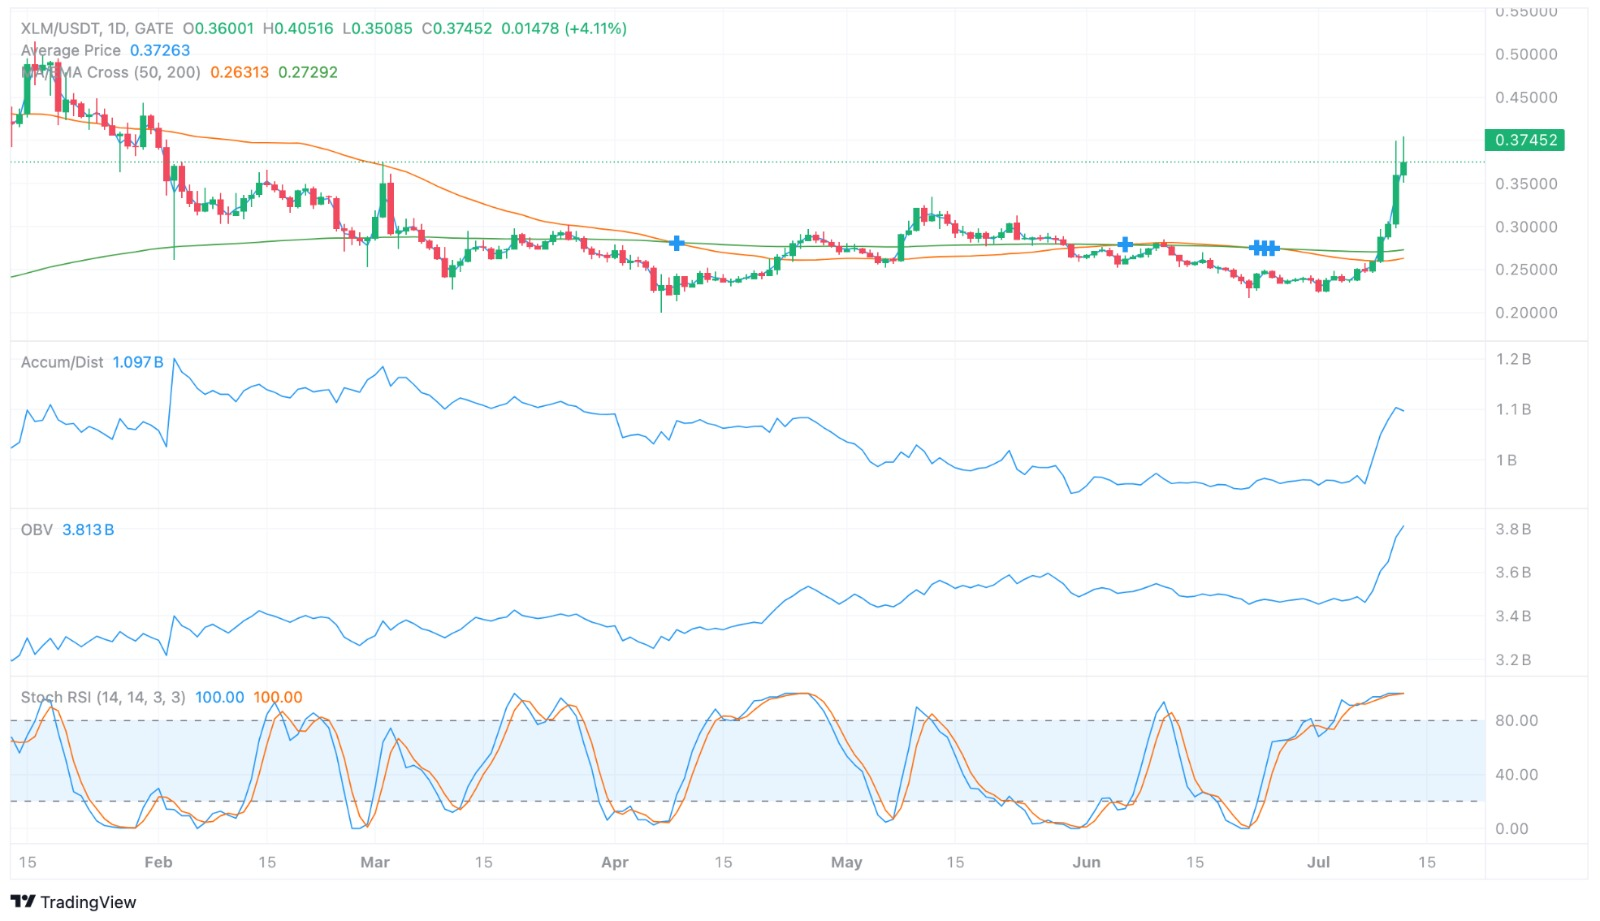
These suggest the rally is supported by real buying pressure, not short-term speculation. The token is also trading well above both the 50-day at $0.2631 and the 200-day at $0.2729 moving averages, forming a golden cross, often seen as a sign of long-term strength.
Key Price Zones and Short-Term Volatility Risks
Although bullish momentum remains intact, short-term retracements cannot be ruled out. A break below $0.3396 could lead to support tests around $0.30. A further dip may bring the price down to $0.2729, which aligns with the 200-day moving average and past consolidation zones.
These levels will be critical in assessing whether the rally has broader sustainability. However, if current momentum persists, XLM could retest $0.4078 and potentially climb to $0.45 or $0.50 in the coming weeks.
The $0.37–$0.40 range remains a crucial zone. Holding above this could support market confidence and attract more inflows, especially if the broader crypto sentiment remains favorable.
XLM’s current price action is driven by protocol upgrades, institutional RWA use cases, and altcoin market rotation. Technical patterns confirm a bullish outlook, though overbought signals suggest possible short-term pullbacks. The $0.37–$0.40 zone will be key in determining near term direction.


