
- Inverse head and shoulders pattern forms on total crypto market chart, signaling a potential bullish breakout near $2.16T valuation.
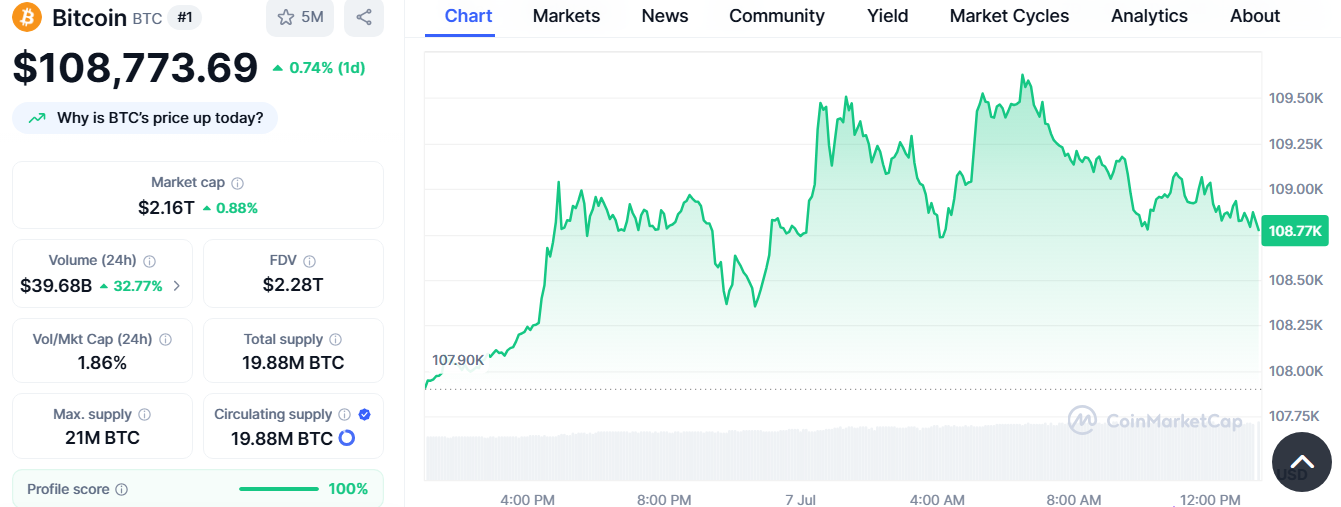
- Bitcoin holds above $108K despite a minor dip, aligning with broader consolidation under neckline resistance.
- 24-hour crypto market volume rises over 31%, adding strength to the breakout scenario toward a projected $5 trillion target.
A distinct inverse head and shoulders pattern has developed on the total cryptocurrency market cap chart, indicating a potential bullish breakout. This classic technical structure has emerged alongside stable Bitcoin performance near major price levels and a sharp rise in market activity. The total market valuation currently stands at $2.16 trillion, with price consolidation occurring just beneath key resistance.
The pattern’s structure closely mirrors historical setups seen during previous crypto market surges. Notably, similar formations preceded major breakouts that drove Bitcoin and other assets to new all-time highs. The current neckline zone now serves as a critical resistance area. Sustained movement above this level, especially with increased volume, could validate the formation and open the door to a broader rally.


Bitcoin Maintains Position Despite Minor Pullback
Bitcoin is currently priced at $108,804, having lost 0.81% within the past 24 hours. This is in spite of the dip, which has seen the price hold above the $108K mark. Daily support levels have remained strong, capping downside pressure. The circulating supply of Bitcoin is 19.88 million BTC.
This price movement aligns with the broader trend visible on the market cap chart. In particular, the price action has respected neckline resistance in the highlighted head and shoulders structure. The chart suggests that a confirmed breakout could push Bitcoin, and the market more broadly, to new levels.
Rising Volume and Liquidity Support Bullish Setup
The fully diluted market cap of cryptocurrencies currently has a valuation of 2.28 trillion, with the total market at 2.16 trillion. Market volume has increased 31.66% during the past 24 hours to $39.4 billion.
This increase in volume supports the bullish structure forming on the chart. The volume-to-market cap ratio sits at 1.86%, reinforcing the presence of increased liquidity across the market. This trend is especially important given the neckline retest and consolidation within the highlighted pattern.
$5T Target in Focus as Breakout Zone Holds
Technical projections based on the height of the pattern estimate a market cap target of nearly $5 trillion. This potential move would more than double the present valuation. For now, price action remains concentrated near the neckline, with no confirmed breakout yet.
However, momentum appears to be building, supported by increasing trade volume and structural alignment with previous bullish cycles. The right shoulder is currently forming, and price action remains near critical confirmation zones. Market participants continue to monitor these developments closely.


