- ADA broke above $0.60, turning it into short-term support, with $0.62–$0.65 as key resistance due to high open interest.
- RSI at 50.30 and MACD crossover suggest growing bullish momentum after weeks of weak market structure.
- Despite breaking above the 50-day MA, ADA still faces strong resistance at the 200-day MA near $0.623.
On July 3rd, at the time of writing, Cardano (ADA) was up by 8.63% to trade at $0.6032. Despite this sharp rise, the token is down by 13.32% in the past month. According to CoinMarketCap, ADA’s market cap reached $21.36 billion, rising by 8.77%, while its 24-hour trading volume surged by 42.52% to $1.03 billion.
The rally follows Bitcoin’s 2.3% climb to $109,000, lifting sentiment across major altcoins. Cardano also benefited from Bitcoin integration news through the Lace Wallet, strengthening its technical setup. ADA’s 30-day beta with Bitcoin is at 0.87, which amplified its upside during the broader crypto recovery.


Rising Volume and Resistance Flip
ADA broke above the $0.60 resistance level, which now acts as potential short-term support. The move comes after a reversal from the $0.53 local bottom, resulting in a three-day rally. Volume surged to 33.13 million ADA, indicating renewed buying activity and improved market activity.
Despite the rally, the broader trend remains under pressure. ADA still trades below the $0.70 resistance, which is a key psychological barrier. Analysts emphasize the $0.62–$0.65 zone, where 1.21 billion ADA open interest is concentrated. This area may determine if the bullish setup continues in the short term.
Momentum Indicators Support Upside Continuation Attempts
Momentum indicators now favor buyers. The RSI rose to 50.30, crossing above the neutral line for the first time in weeks. This move indicates growing buying interest after recent weakness.
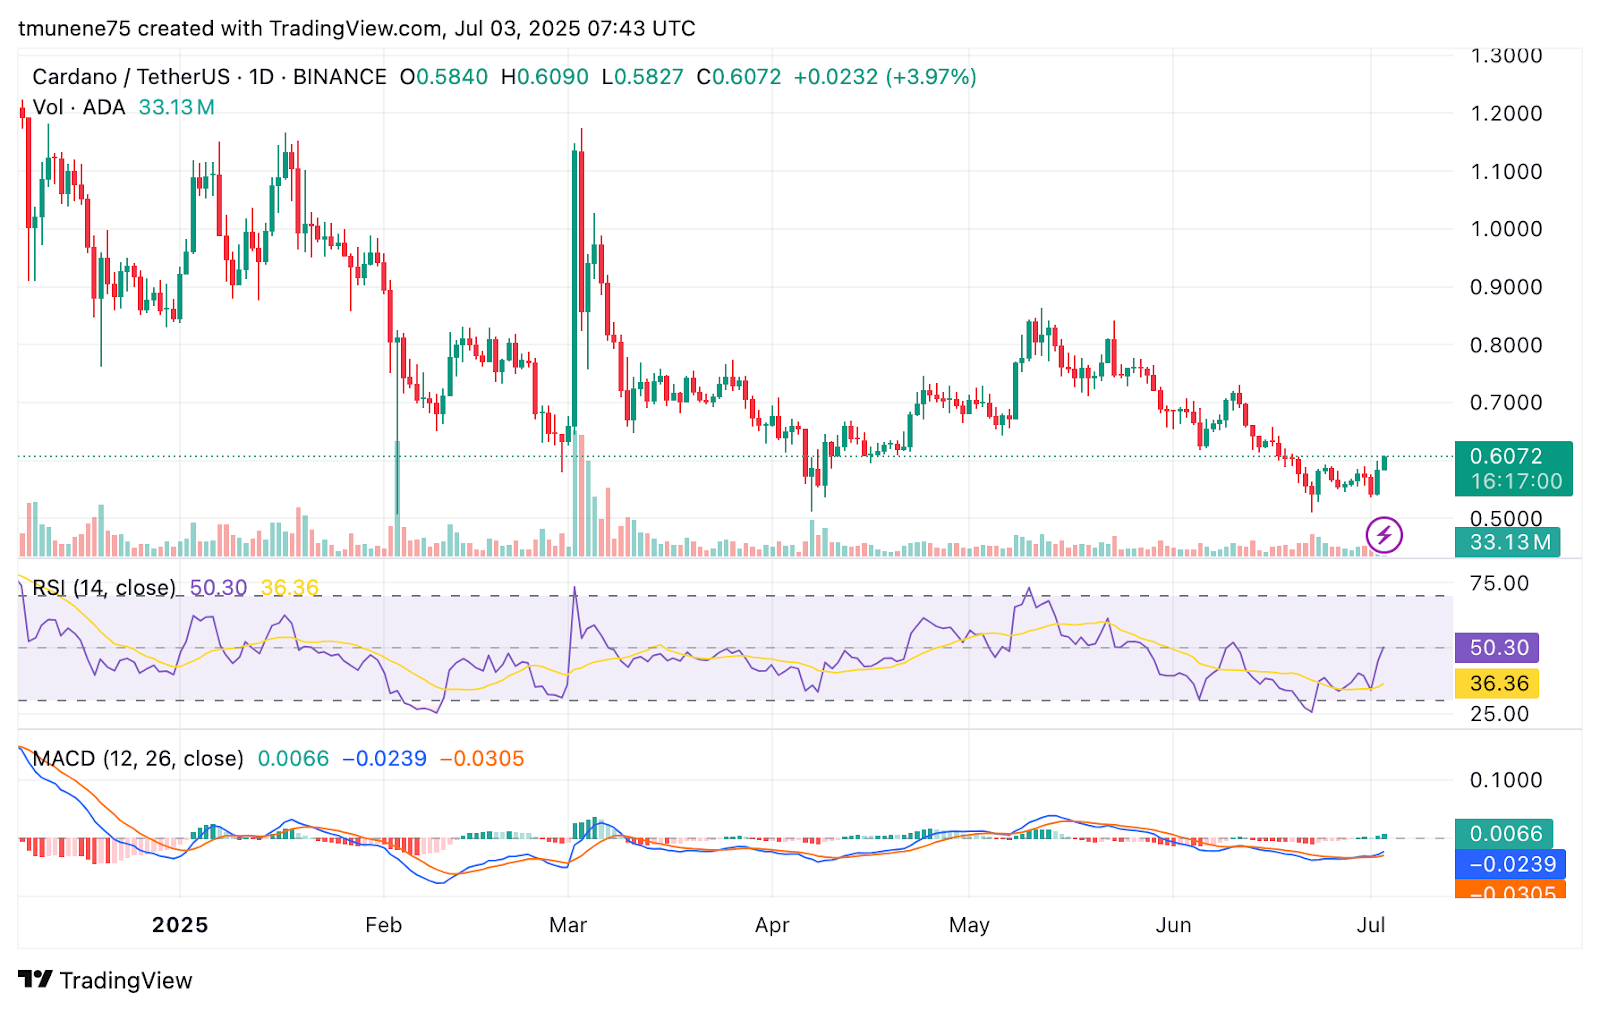 ADA/USDT 1-day price chart, Source: TradingView
Meanwhile, the MACD turned positive, with the MACD line at 0.0066 crossing above the signal line at -0.0305. The green histogram confirms a bullish crossover, ending a long bearish outlook.
As momentum shifts, ADA also moved above its 50-day moving average of $0.566. This is typically a bullish signal when combined with rising volume. However, the price is below the 200-day moving average at $0.623. The 200-day level may act as a strong resistance if buyers push higher.
Technical Barriers and Macro Trends
Trading above the 50-day MA for the first time since a sustained downtrend offers a short-term advantage to bulls. Still, the macro setup is bearish, and ADA must close above the 200-day MA to challenge that pattern.
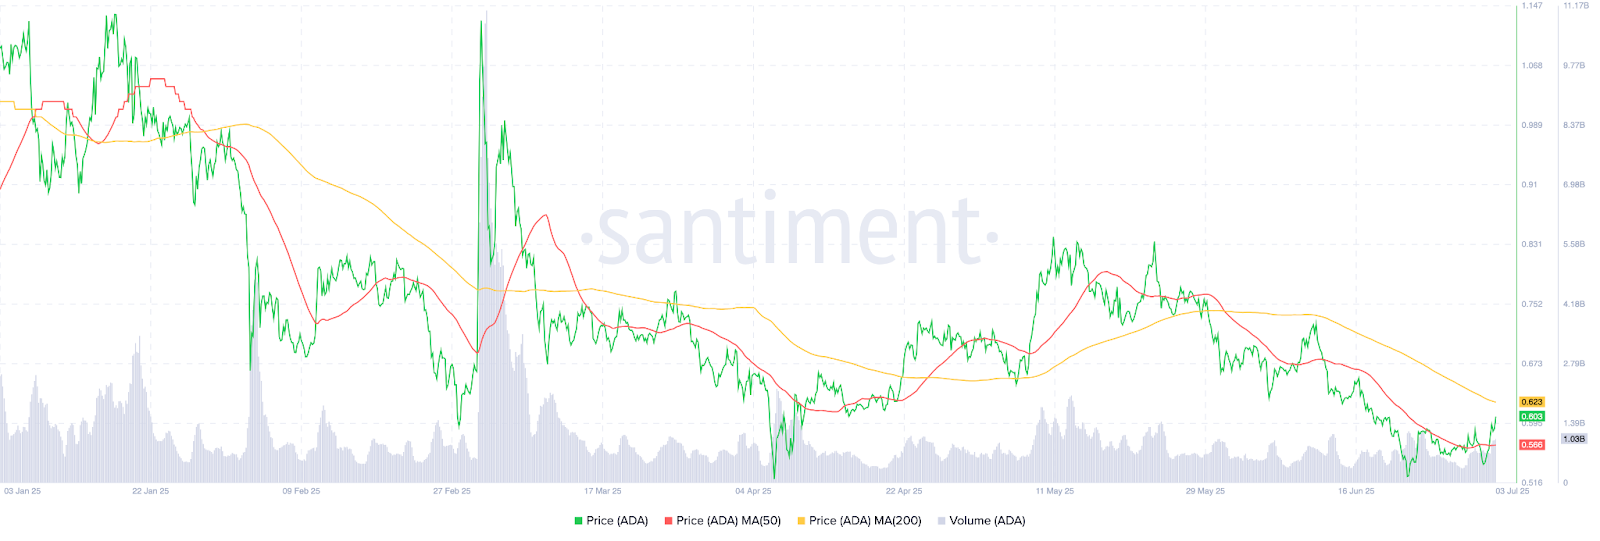 Cardano price dynamics chart, Source: Santiment
Rising volume and a strong RSI reading support the attempt, but resistance between $0.62 and $0.63 is critical. Prior to this move, ADA’s volume had declined since mid-May.
The recent accumulation indicates renewed interest, especially with Bitcoin’s integration narrative. Total supply is at 44.99 billion ADA, with 35.37 billion circulating. The FDV is at $27.18 billion, and the volume-to-market cap ratio is 4.82%.
Potential July 04 Price Scenarios
On the upside, If ADA holds above $0.60 with volume support, it could test $0.635 and extend toward $0.65. However, if price loses $0.60 support, ADA could pull back to $0.585 or even drop toward $0.56.
Overall, ADA’s technical outlook for July 04 favors short-term bullish, backed by volume growth and positive momentum indicators. However, overhead resistance near the 200-day MA remains a critical test for any sustained breakout.


