
- TIA’s rebound from $1.34 signals strong intraday support and renewed buying interest
- Bullish breakout above $1.42 could push TIA price toward the $1.45 resistance
- Liquidations of long positions hint at healthier market structure and reduced leverage
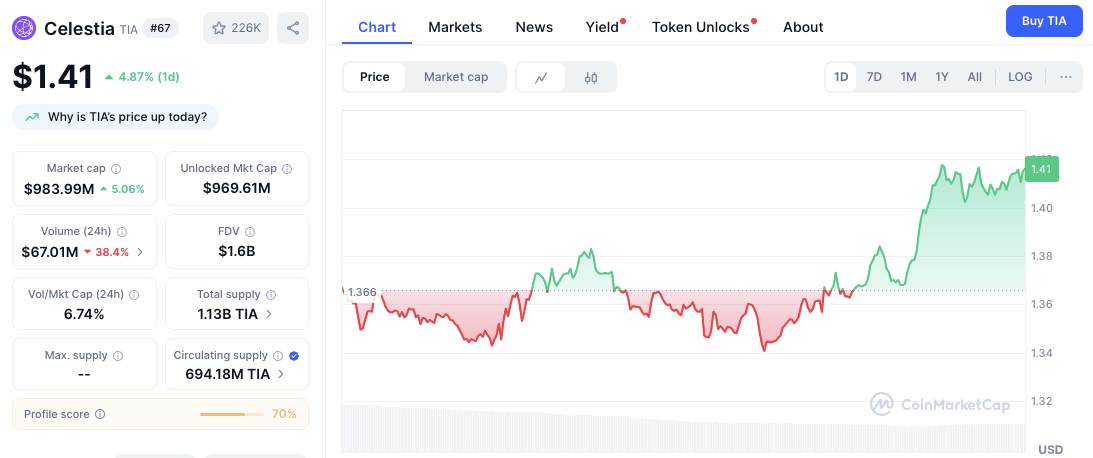
Celestia (TIA) has sparked renewed interest in the crypto market after surging past a notable resistance level. As of press time, TIA trades around $1.40, up over 4% in the last 24 hours. This comes after a volatile dip that saw prices retreat to $1.34 before bouncing back with strength.
The coin now hovers just below the $1.42 mark, teasing traders with a possible continuation of the uptrend. With bullish sentiment building and short-term technicals painting an optimistic picture, the question now is whether TIA can sustain this upward pressure.


Support Holds Firm, Resistance in Sight
After briefly slipping below $1.36, TIA found solid footing near the $1.34 level. This level has now emerged as a critical intraday support. Besides, the $1.36 mark proved psychologically important, drawing back buyers who helped fuel the rebound.
On the upside, the immediate challenge lies at $1.42. A convincing breakout here could set the stage for a rally toward $1.45.
These resistance and support levels are not just technical checkpoints they reflect real market behavior. The price action suggests a shift in sentiment, possibly hinting at stronger bullish participation. If TIA clears $1.42 with volume confirmation, it could validate a breakout continuation toward the projected $1.45 target.
Market Indicators Reflect Mixed Sentiment
Market dynamics present a nuanced view. TIA’s market cap now stands at $978.63 million, a 4.22% rise reflecting growing investor confidence.
However, trading volume dropped nearly 40% over 24 hours. This decline in volume hints at lower selling pressure but also underscores a need for caution, as low volume can undermine breakout strength.
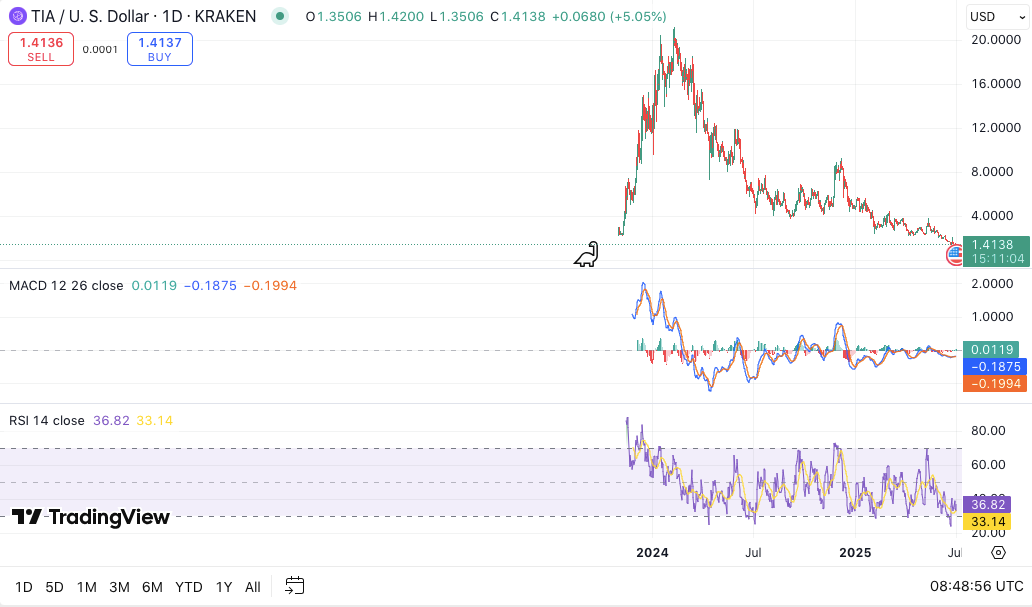
On the technical side, the MACD indicator reveals that bearish momentum is fading. Though the histogram remains negative, it shows signs of a potential bullish crossover. The Relative Strength Index (RSI) stands at 27.06, suggesting TIA is nearing oversold territory. This could signal an upcoming reversal or, at the very least, price stabilization.
Liquidation Data Points to Short-Term Caution
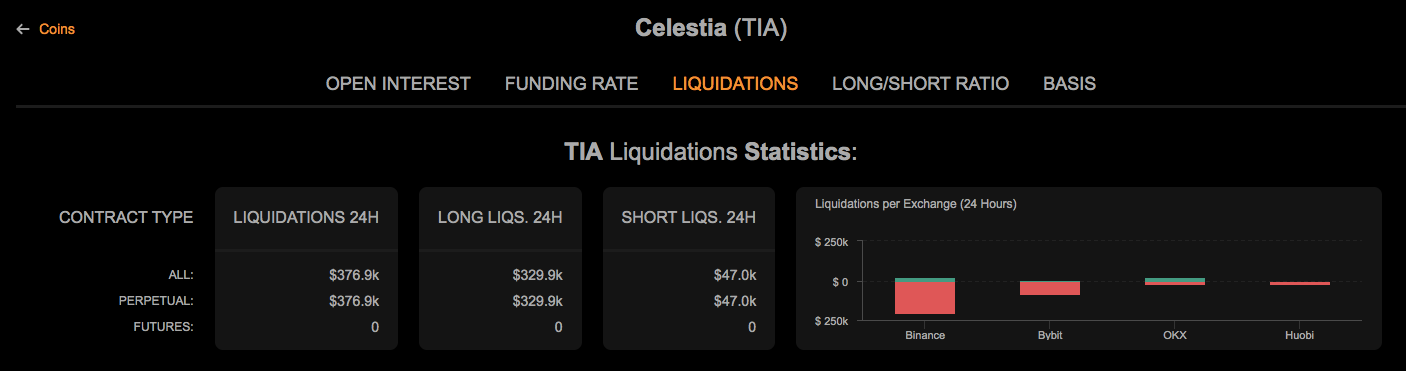
Over the past day, TIA saw total liquidations of $376.9k nearly 88% from long positions. Binance led these liquidations, followed by Bybit and OKX. The data suggests some overleveraged bullish positions may have been flushed out, possibly paving the way for a healthier trend ahead.


