
- Dogecoin eyes $1 target as fractal patterns mirror previous bullish breakouts
- MACD and RSI signal weak momentum, suggesting short-term bearish sentiment persists
- Persistent net outflows highlight selling pressure despite long-term bullish narratives
Dogecoin’s recent price drop has not dampened bullish expectations, as analysts like Trader Tardigrade continue to highlight historical chart patterns that hint at a major surge. The popular meme coin, despite its current weakness, may be setting the stage for a powerful breakout.
As of June 13, 2025, Dogecoin trades at $0.1747 after falling over 8% in the last 24 hours. Its market cap hovers around $26.1 billion. While momentum indicators suggest continued pressure, some analysts believe a larger move upward may be forming.


Fractal Pattern Suggests $1 Target
Trader Tardigrade points to a consistent trend in Dogecoin’s weekly chart small upward moves followed by larger surges. These “pump cycles” appear to follow a fractal pattern. In the past, each small price rally has led to a stronger upward movement.
Peaks at $0.22 and $0.45 followed similar setups. Currently, DOGE is rebounding from an ascending trendline after a minor pump. If history repeats, this setup could lead to a push toward the $1 mark.
#Dogecoin's weekly chart shows small pumps followed by big pumps 🔥
— Trader Tardigrade (@TATrader_Alan) June 12, 2025
The current big pump could send $DOGE to $1 🚀 pic.twitter.com/4lDEz9s570
Significantly, this ascending structure has served as reliable support. If buyers step in around the $0.15 level, a sustained rally becomes more likely. However, DOGE must overcome resistance levels near $0.22 and $0.45 before even testing $1.
These levels have acted as strong rejection zones in previous cycles. The pattern only holds if buying momentum returns.
Market Indicators Flash Bearish
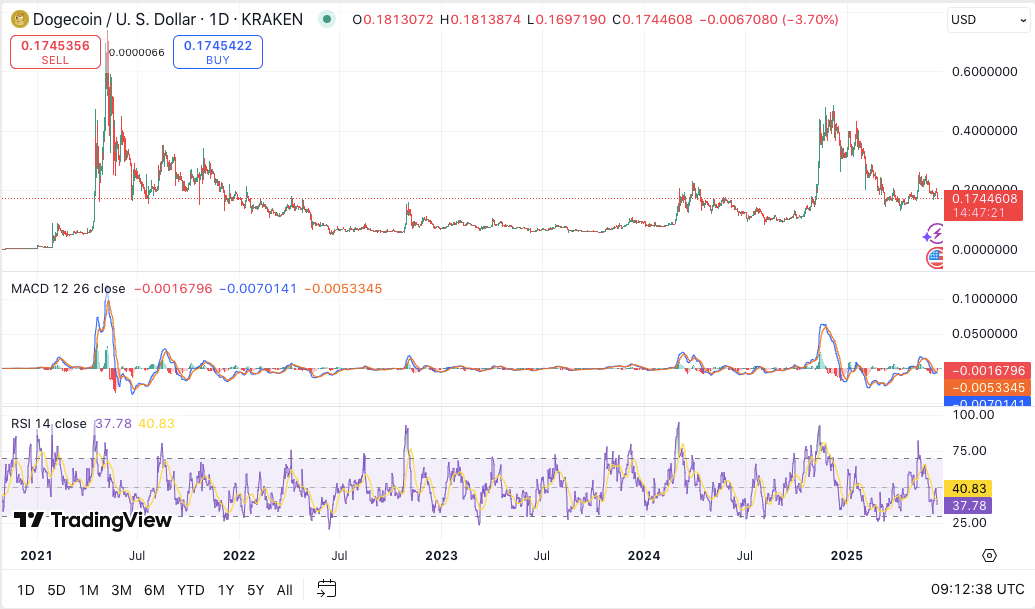
Despite the bullish pattern, technical indicators tell a different story for now. The MACD shows the MACD line at 0.00167, sitting below the signal line at 0.00700. This reveals bearish momentum in the short term.
Additionally, the RSI stands at 37.85, which is nearing oversold territory. While this may attract bargain hunters, it also reflects weak current sentiment.
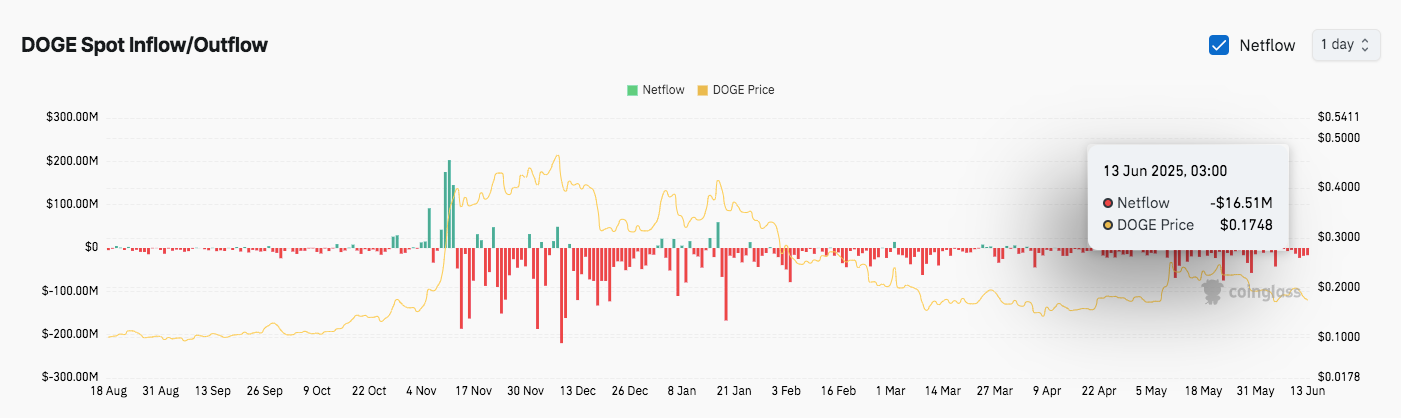
DOGE’s spot inflow/outflow data reveals a consistent trend of outflows dominating inflows since November 2024. Notably, outflow spikes in November, December, and January all preceded price drops.
As of June 13, net outflows reached $16.51 million, reflecting prevailing market hesitation. These outflows often align with major resistance points—most notably around $0.50.
Disclaimer : The content shared by The Daily Crypto Post is intended for informational and educational purposes only and does not constitute financial or investment advice. Readers are encouraged to do their own research or consult with a licensed professional before making any financial decisions. The Daily Crypto Post will not be accountable for any financial losses.


