
- Spot Bitcoin ETFs are seeing steady inflows, averaging $250M daily, signaling strong institutional demand.
- Persistent BTC outflows from exchanges highlight continued accumulation and reduced sell-side pressure.
- Despite short-term price dips, ETF demand and shrinking exchange supply suggest a bullish long-term market structure.
Spot Bitcoin ETFs have shown consistent inflows in recent days, contributing to growing market strength and sustained buying activity. Data From glass node reveals that these financial products have attracted over $300 million in daily inflows throughout the past week, marking a period of reinforced institutional interest. As a result, Bitcoin’s price momentum appears to be largely supported by this ongoing influx of capital.
The latest figures show that the 7-day simple moving average (SMA) of ETF inflows stood at approximately 2.2K BTC as of yesterday. Based on prevailing market prices, this equates to nearly $250 million in net daily purchases. The influx has remained positive across several major ETF issuers, with consistent demand visible even during minor market pullbacks.


Spot ETFs Anchor Bitcoin Amid Rising Institutional Demand
The sustained capital inflow reflects a shift in investor sentiment, where spot Bitcoin ETFs are increasingly being treated as a preferred vehicle for regulated market exposure. Unlike futures-based products, these spot ETFs provide direct exposure to Bitcoin’s price, which may be drawing continued interest from both retail and institutional participants.
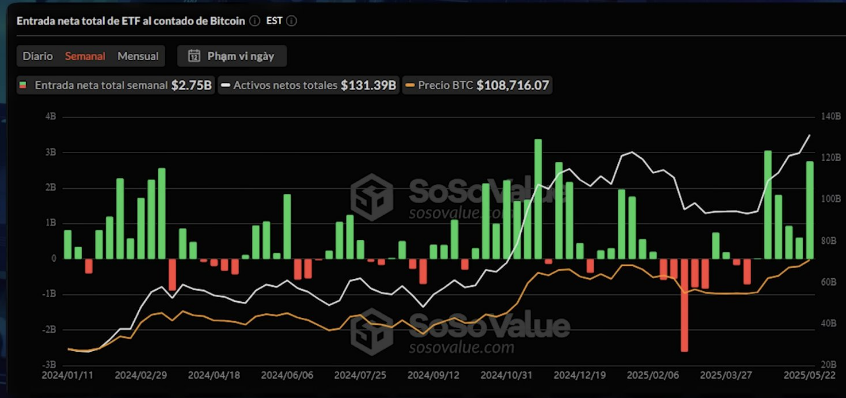
Analysis of flow data shows inflows have been persistent since late April, with firms such as BlackRock, Fidelity, and Ark 21Shares regularly contributing to the total. Currently, Bitcoin has seen a slight decline of 2.9% currently trading at $105,308 with the volume at $60.99B which is a 16.6% increase. As of now, ETF-driven demand appears to be a stabilizing force in Bitcoin’s market structure.
Sustained Exchange Flows Signal Bullish Sentiment
Data from Coinglass displays Bitcoin (BTC) spot inflow/outflow netflows alongside the BTC price trend. A striking pattern through 2025 is the persistence of heavy net outflows, especially throughout March, April, and May 2025. Many daily outflows during this period range between -$300M to nearly -$900M, indicating that large volumes of BTC are leaving centralized exchanges.
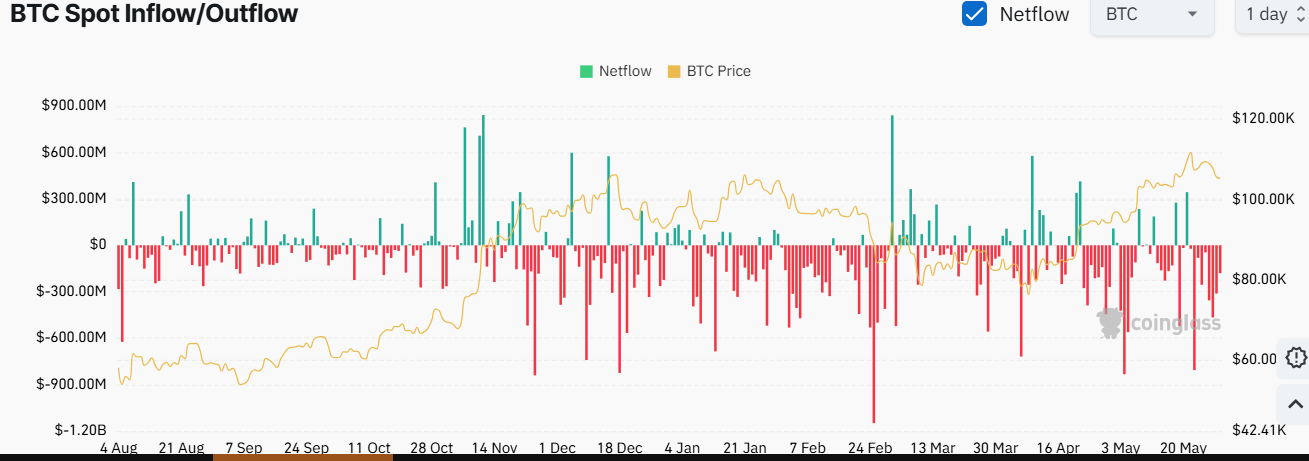
Despite the overall outflow trend, there are a few notable inflow events. In late February 2025, a significant net inflow estimated at around $900M occurred—one of the highest during the year. This spike suggests traders may have moved BTC to exchanges, likely in anticipation of selling or profit-taking. Additionally, mid-March and early April saw smaller inflow surges, suggesting temporary shifts in sentiment or market reactions to price volatility.
However, if BTC approaches major resistance levels (e.g., psychological levels like $120K), inflows may spike as holders take profit, potentially leading to temporary corrections. In summary, 2025 netflow data reflects bullish sentiment, strong accumulation, and tightening exchange supply—all of which continue to support higher BTC prices unless disrupted by significant market shifts.


