
- ETH eyes breakout as ascending triangle pattern nears apex near $2,720 resistance
- Breakdown below $2,550 trendline could trigger sharp declines toward $2,471
- RSI near 65 and fading MACD momentum hint at possible short-term consolidation
Ethereum (ETH) is at a critical technical juncture as bulls and bears wrestle for control ahead of June. With ETH hovering around $2,626 after a 3.84% dip in the past 24 hours, market participants are closely watching key support and resistance levels. The battle is intensifying near the $2,720 mark, which could decide whether ETH climbs toward $3,600 or dips further in the near term.
Potential Breakout Pattern Builds Momentum
Captain Faibik, a well-known crypto analyst, has identified an ascending triangle forming on the 12-hour ETH/USDT chart. This bullish continuation pattern shows higher lows converging toward a horizontal resistance zone near $2,720. Despite multiple failed attempts to break above this level, bullish pressure appears to be building.


Significantly, as long as the ascending trendline holds firm, the structure remains intact. A confirmed breakout with strong volume above $2,720 could spark a rapid surge, initially targeting $3,000. If momentum continues, ETH may even reach $3,600 in June, fueled by renewed investor optimism.
However, a drop below the rising support trendline, currently near $2,550, could invalidate the pattern. This would shift sentiment quickly, triggering potential sell-offs.
Short-Term Weakness Seen on Lower Timeframes
On a shorter 4-hour timeframe, analysts at Rose Premium Signals are warning of weakening momentum. Ethereum is currently testing the ascending trendline around $2,630. Failure to reclaim this support may open the door to deeper downside levels.
📉 #Ethereum ( $ETH) 4H Analysis – Breakdown Watch
— Rose Premium Signals 🌹 (@VipRoseTr) May 29, 2025
ETH is currently testing the ascending trendline support on the 4-hour chart around $2,630.
🔻 A confirmed breakdown below this trendline could lead to further downside targets:
🎯 Target 1: $2,532
🎯 Target 2: $2,471
🧠 The… pic.twitter.com/zs1uNSRbrl
A confirmed breakdown here could target $2,532 and potentially slide further to $2,471. The recent pullback, combined with the inability to sustain above critical support, highlights short-term selling pressure. If the bulls fail to defend this area, sellers may tighten their grip.
Market Indicators Suggest Mixed Signals
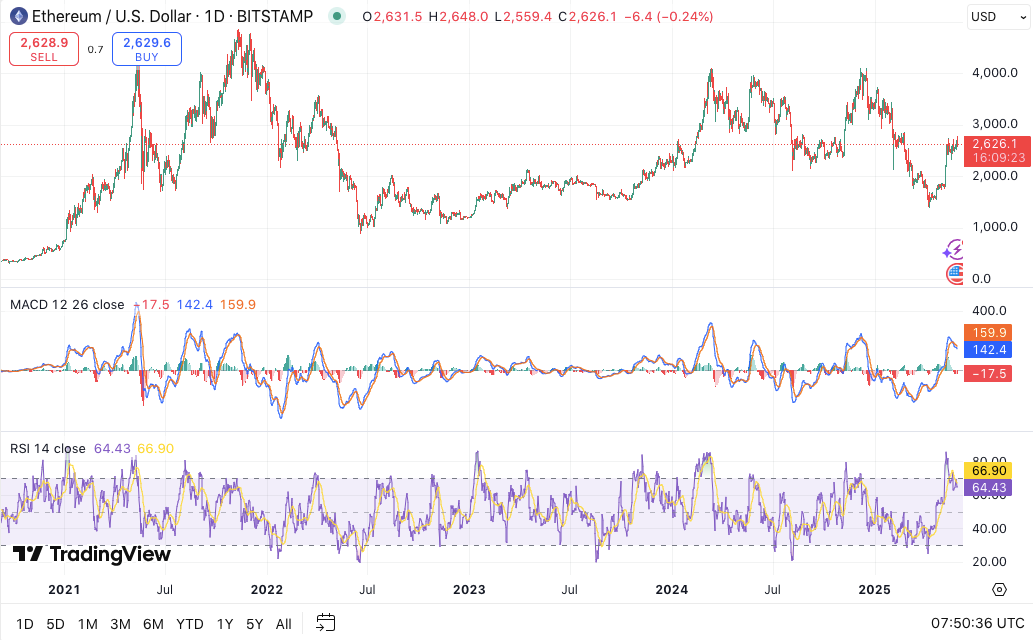
Technical indicators remain mixed. The RSI is currently around 65, not yet overbought but close to levels that often precede consolidation. Meanwhile, the MACD histogram has turned slightly negative, suggesting momentum could be fading, at least for now.


