
- XRP must close above $2.20 to confirm bullish strength and trigger momentum
- Breakout likely between July and mid-September based on triangle pattern timing
- Bearish capital outflows and neutral indicators hint at consolidation before breakout
XRP is once again commanding attention as its price movements near a critical inflection point. Traders are watching closely to determine whether the digital asset is preparing for a strong breakout or heading for a key retest. After seeing a recent 8.11% jump in 24 hours, XRP is trading around $2.18.
However, it has dipped 2.54% over the past week. These mixed signals suggest the asset may be gearing up for a larger directional move. With the spotlight on both support and resistance zones, market participants are assessing crucial price behavior on the daily time frame.


Key Resistance and Retest Zones in Focus
According to EGRAG CRYPTO, XRP must decisively close full-bodied daily candles above certain price levels to confirm bullish strength. These resistance targets include $2.20, $2.30, $2.34, $2.48, and $2.65. A confirmed daily close above $2.20 could serve as a springboard toward higher levels. Each progressive close signals building bullish momentum and possibly a return toward January’s peak above $3.
Conversely, if XRP fails to hold above $2.20 and retreats, $2.08 and $2.04 may act as immediate retest zones. These levels could offer temporary support before any potential recovery. However, a daily close below $2.04, $1.90, or $1.71 may indicate the return of bearish pressure and signal further downside.
#XRP – Retest or Breakout? 🔍
— EGRAG CRYPTO (@egragcrypto) June 24, 2025
If #XRP did not close a full daily candle above $2.20, then the price behavior is suggesting that $2.08 and $2.04 could serve as key retest zones 🌀.
⚪️Critical Resistance Targets (full body candles on daily):
▫️$2.20
▫️$2.30
▫️$2.34
▫️$2.48… https://t.co/FiARFojRZs pic.twitter.com/pIwceICN46
Breakout Window: Timing Based on Historical Patterns
Another analysis by EGRAG CRYPTO sheds light on XRP’s long-term chart structure. A 334-day symmetrical triangle formation suggests a breakout may occur between 75% and 95% of the pattern’s duration.
That puts a likely breakout window between early July and mid-September 2025. This time-based insight adds an important perspective for investors looking to position ahead of major volatility.
#XRP – The Breakout Is Coming – Base On Math🔥:
— EGRAG CRYPTO (@egragcrypto) June 24, 2025
🔳 Based on historical patterns, breakouts from triangle formations (symmetrical, ascending, or descending) typically happen around 75% to 95% of the total pattern duration.
🔳 Calculations for a 334-day pattern:
▫️75% of 334… pic.twitter.com/64hhEK0J0A
Market Indicators and Capital Flow Insights
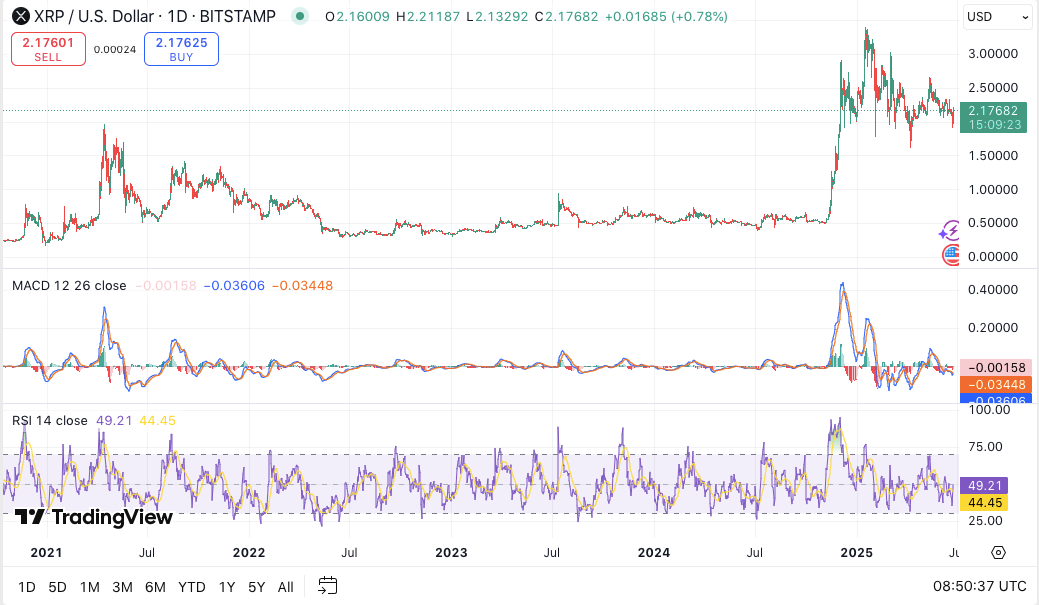
Technically, XRP’s indicators suggest a period of consolidation. The MACD sits in neutral territory but leans slightly bearish. The RSI, currently near 49.51, reflects neutral momentum. These signals align with a market that is pausing after recent volatility.
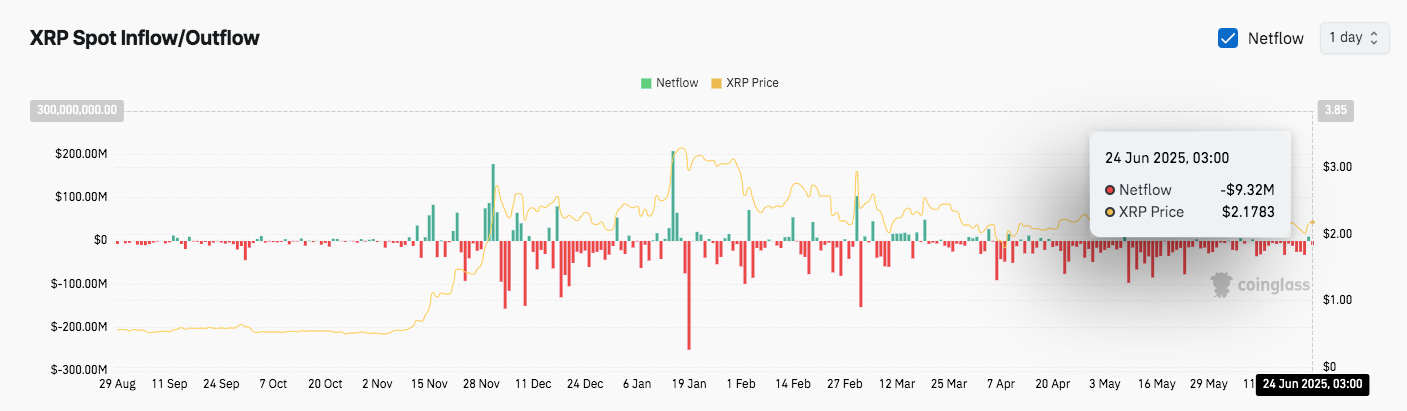
Moreover, persistent net outflows from exchanges add to the cautious tone. Capital outflows, especially the massive $300M spike in January, reveal strong selling pressure. As of June 24, XRP’s net outflow remains negative at $9.32M, reinforcing the market’s tentative sentiment.


