


- Major whale’s $70M sale caused XRP’s price fluctuations and unrealized losses.
- XRP faces a potential drop to $2.30, with $1.90 as the ultimate support level.
- Market sentiment remains uncertain as inflows and outflows shift rapidly.
XRP’s price has experienced a significant shake-up following a massive sale of 30 million XRP, valued at approximately $70 million. The move by one of the largest XRP whales has not only caused price fluctuations but also led to a loss of nearly $1 billion in unrealized profits.
Technical Indicators Suggest Price Decline Could Be Imminent
According to EGRAG CRYPTO’s analysis, XRP is currently testing critical technical levels that could indicate further downside. The 21 Exponential Moving Average (EMA) is being retested, with the lower boundary of the price triangle hovering around $2.93.
While there is still some hope for support, EGRAG CRYPTO suggests that XRP could dip as low as $2.30. However, $1.90 is viewed as the ultimate support level. If the price reaches this point, it may be a crucial opportunity for long-term buyers.
Key Resistance and Support Levels
Looking ahead, XRP’s price may be caught in a tug-of-war between potential upside and downside movements. On the upside, analysts have projected a possible target of $4 if the price breaks through resistance.
Conversely, a downside breakout could lead XRP to hit $2.40. The possibility of either direction remains almost evenly balanced, with a 50% chance for each outcome. This suggests a high degree of market uncertainty, making it crucial for traders to stay vigilant.
Market Sentiment Shifts with Inflows and Outflows
Besides the technical indicators, XRP’s market sentiment has also been fluctuating in response to significant inflows and outflows. Data reveals that between April and November, outflows consistently outpaced inflows, which signaled bearish sentiment.


Source: Coinglass
However, mid-November saw a notable spike in inflows, exceeding $200 million, which coincided with a price rally. December and early January saw inflows but were followed by sharp outflows exceeding $200 million as the price peaked near $3, signaling profit-taking.
Momentum Indicators Point Toward Bearish Pressure

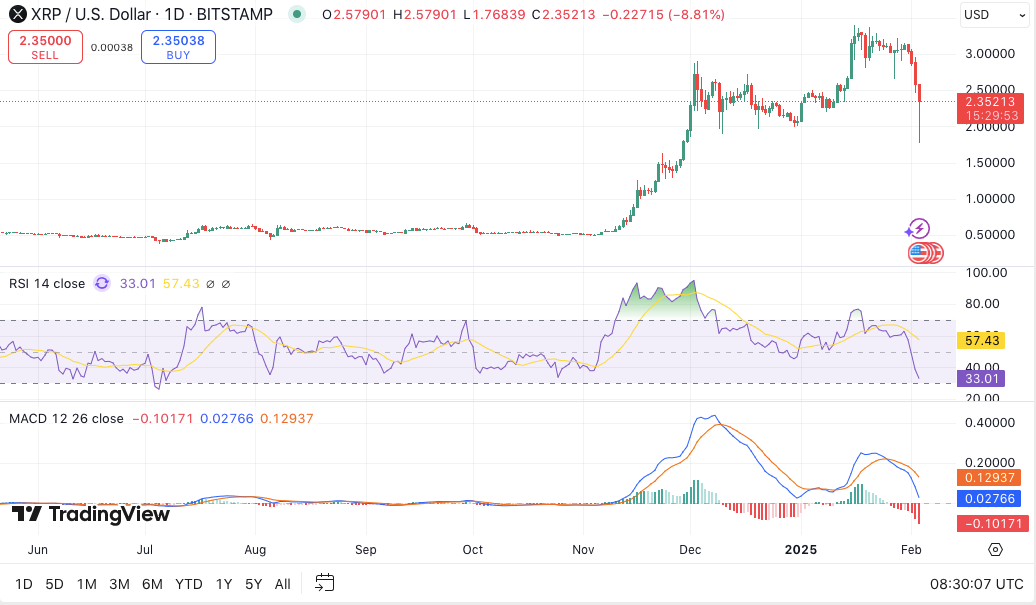
XRP/USD daily price chart, Source: TradingView
As of press time trading at $2.40, two key momentum indicators, the Relative Strength Index (RSI) and the Moving Average Convergence Divergence (MACD), are currently signaling bearish pressure. The RSI stands at 32.28, which is approaching oversold levels. This suggests a possible reversal if buyers begin to step in.
However, the MACD is showing negative values, indicating continued downward momentum. With both indicators pointing toward further weakness, the market sentiment remains uncertain, and traders must assess their positions carefully.