


- XRP’s historical crashes often triggered massive rebounds and bullish rallies.
- Oversold RSI suggests a potential rebound despite the ongoing bearish trend.
- Strong buying pressure could push XRP beyond $3, igniting a bullish phase.
XRP has experienced significant price fluctuations, with a recent crash shaking investor confidence. However, analysts suggest that history may repeat itself, leading to a strong recovery.
According to EGRAG CRYPTO, XRP’s recent downturn mirrored past price crashes that preceded massive bullish rallies. The analyst emphasized that XRP had already shown signs of a potential 40% drop before the crash occurred.
Now, with strong buying pressure, bulls are determined to push XRP beyond $3, potentially igniting the next bullish phase. Historical patterns indicate that similar downturns resulted in substantial rebounds, offering insights into XRP’s future trajectory.
XRP’s Historical Price Crashes and Recoveries
Analyst Dom highlighted two key historical events that resemble the recent XRP crash. In March 2020, the COVID-19 panic sell-off caused XRP to plunge 55.37% within days, triggering a wave of liquidations.
Despite the sharp decline, the market quickly found a bottom, leading to a recovery exceeding 200%. Similarly, in December 2020, the SEC lawsuit against Ripple caused XRP to drop 70.61%, reaching a low of $0.17.
Fear dominated the market, but a liquidity vacuum enabled aggressive buying, resulting in a 1,000% rally that pushed XRP to nearly $2 by April 2021. These past events indicate that XRP’s sharp declines often serve as launching points for strong price surges.
Current Market Trends and Technical Indicators

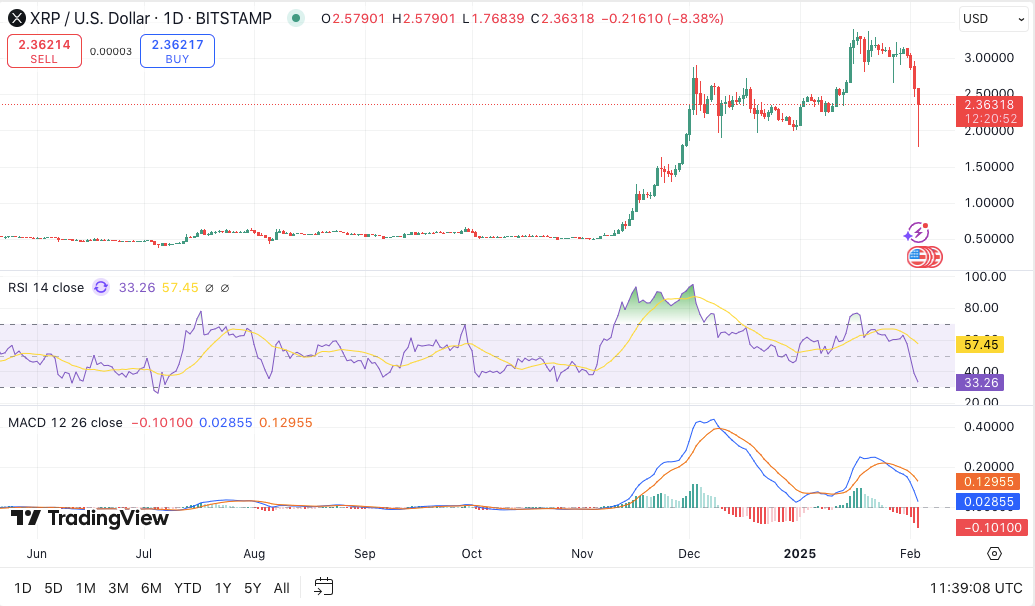
XRP’s current price stands at $2.39, with a 24-hour trading volume of $34.58 billion. The asset has declined 16.14% in the past 24 hours, reflecting ongoing market volatility. Despite the short-term bearish trend, technical indicators suggest potential for a reversal.
The Relative Strength Index (RSI) is at 33.57, indicating oversold conditions. This level often signals a potential rebound or at least a temporary pause in the bearish momentum.
Additionally, the MACD indicator shows that the MACD line is below the signal line, reinforcing the ongoing bearish trend. The histogram also displays negative values, confirming the downward pressure in the market.