


- Bitcoin’s corrections are becoming milder, signaling increased market stability.
- Massive BTC outflows from exchanges highlight strong institutional accumulation.
- Technical indicators suggest Bitcoin may soon regain bullish momentum.
Bitcoin has experienced a series of market corrections during its bull cycles, with each successive correction showing reduced severity. Data from CryptoBull reveals past drawdowns during bull markets, including a 49% dip in the Genesis cycle, 71% from 2011 to 2013, 36% from 2015 to 2017, and 63% from 2018 to 2021.
In 2024, Bitcoin corrected by 32%, and as of early 2025, the cryptocurrency is down just 16% from its all-time high. The declining severity of corrections suggests Bitcoin’s increasing market maturity. Meanwhile, on-chain data highlights major Bitcoin outflows from exchanges, signaling strong accumulation by institutional investors.
#Bitcoin: Bull Market Correction Drawdowns 🚨 👇
— CryptoBusy (@CryptoBusy) February 6, 2025
Genesis to 2011 Bull: -49%
2011 to 2013 Bull: -71%
2015 to 2017 Bull: -36%
2018 to 2021 Bull: -63%
2024: -32%
This 2025, $BTC is just down -16% from its ATH.
(The severity of drawdowns during BULL market uptrend has declined as… pic.twitter.com/F4xwp5EAjc
Major Bitcoin Exchange Outflows
On Wednesday, centralized exchanges witnessed a net outflow of over 17,000 BTC, valued at more than $1.6 billion at a price of $98,600 per Bitcoin. Bitwise Head of Research Andrew Dragosch noted that this was the largest single-day outflow since April 2024, indicating significant buying activity from large investors.
Investors typically withdraw Bitcoin from exchanges when intending to hold for the long term, reinforcing a bullish sentiment in the market. Coinbase alone recorded net withdrawals exceeding 15,000 BTC, reflecting notable institutional interest.
Analysis by Timechainindex.com indicates that Coinbase processed transactions splitting over 20,000 BTC into 60 addresses, hinting at possible acquisitions by ETFs or MicroStrategy.
Coinbase split 4 addresses totaling 20,949 BTC, into 60 Addresses: 20 x 245 BTC and 40 x 401 BTC
— Sani | TimechainIndex.com (@SaniExp) February 5, 2025
looks like something is cooking, possible major purchases this week by ETFs or MSTR https://t.co/br8iMlnyaD
Bitcoin’s Market Metrics
Further supporting this accumulation trend, CryptoQuant data shows that all crypto exchanges had a total negative net flow of 47,000 BTC on Wednesday. Out of this, 15,800 BTC came from Coinbase, highlighting the platform’s role in facilitating institutional purchases. This ongoing trend of Bitcoin leaving exchanges reduces available supply, potentially driving upward price pressure in the near term.
Technical Indicators Suggest Potential Upside
Bitcoin’s price stands at $99,014.08, with a 24-hour trading volume of approximately $43.76 billion. Over the past week, the cryptocurrency has declined by 5.97%, though it gained 0.73% in the last 24 hours. Bitcoin’s market capitalization remains strong at $1.96 trillion, supported by a circulating supply of 20 million BTC.

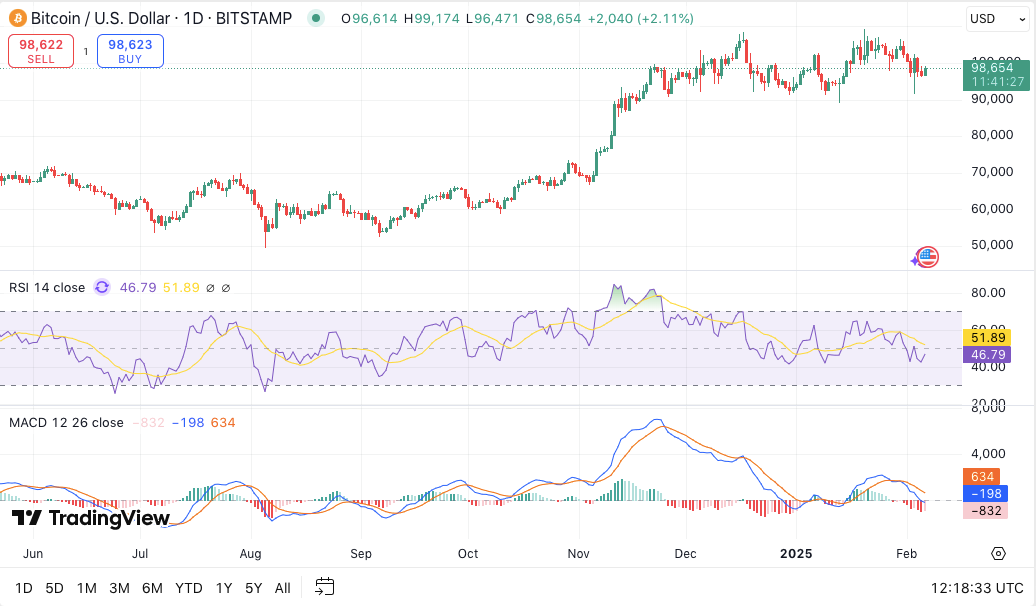
Technical indicators suggest a potential shift in momentum. The Relative Strength Index (RSI) is at 47.64, indicating neutral market conditions and a possible consolidation phase before an upward move. The Moving Average Convergence Divergence (MACD) histogram shows decreasing negative momentum, with the signal line approaching a bullish crossover.